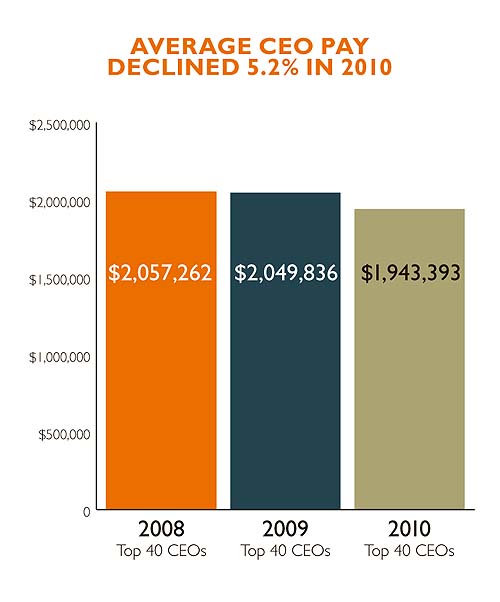
The highest-paid CEOs Oregon public companies shared some of the pink slips and wage cuts that were common across all industries in the past year. For 2009, the total pay for this year’s Top 40 dropped 5% versus last year’s Top 40, and nearly half the current crop received less compensation than they did the prior year. Bonuses plummeted 59%.
Bonuses plummet and pay slides for the highest-paid public company CEOs
LIST RESEARCH AND STORY BY BRANDON SAWYER
The highest-paid CEOs Oregon public companies shared some of the pink slips and wage cuts that were common across all industries in the past year.
For 2009, the total pay for this year’s Top 40 dropped 5% versus last year’s Top 40, and nearly half the current crop received less compensation than they did the prior year. Bonuses plummeted 59%.
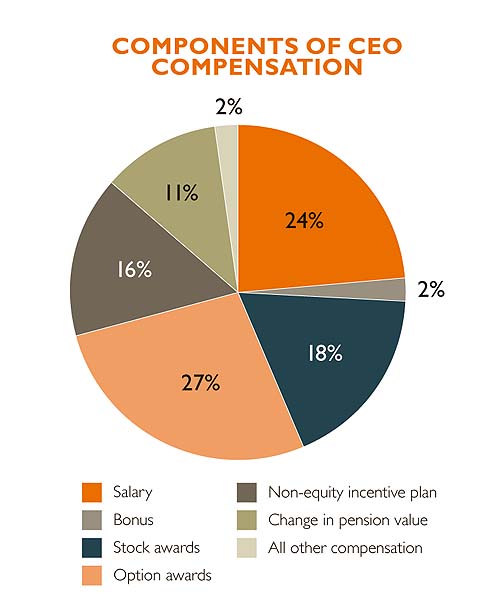
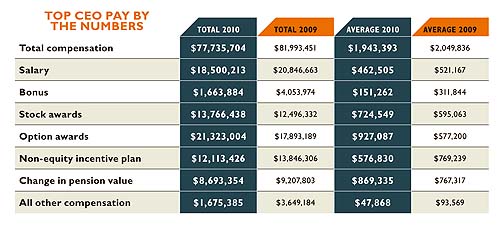
Salaries, non-equity incentives, pension values and other income also fell. The only components that grew were equity stakes: stock awards by 10% and option awards by 19%. Together they account for 45% of our CEO-pay pie, versus just 37% last year. Meanwhile, average stock prices from their companies rose 22% during 2009, no surprise given the market malaise at the end of 2008.
Among the 40 highest-paid top executives, 16 are new to the list: six replaced those from firms that no longer qualify as Oregon-based public companies; while 10 were handed the job in the past year.
Just two of the CEOs are women, Tamara Lundgren (No. 4), the new chief of Schnitzer Steel and Cascade Bancorp’s Patricia Moss (No. 25). The average age is 57, the youngest being 45-year-old Joshua Collins (No. 6) of Blount, and 74-year-old Chester Paulson (No. 38) of Paulson Capital being the oldest.
Nike’s Mark Parker sprinted from fourth to first place, bringing in $13.1 million, while Nike stock appreciated 27% during the fiscal year. Precision Castparts’ Mark Donegan and FLIR’s Earl Lewis traded second and third places, but the biggest climbers by rank were Columbia Sportswear’s Tim Boyle (No. 16) and Patrick Cavanagh of Williams Controls (No. 26). Digimarc’s Mark Davis (No. 27) fell the most with a 91% drop in pay from last year.
 |
 |
 |
|
| RANK | EXECUTIVE (AGE) COMPANY |
TOTAL ’09 ’08 |
SALARY ’09 ’08 |
BONUS ’09 ’08 |
STOCK AWARDS ’09 ’08 |
OPTION AWARDS ’09 ’08 |
NON-EQUITY INCENTIVE PLAN COMP ’09 ’08 |
CHANGE IN PENSION VALUE ’09 ’08 |
ALL OTHER COMP ’09 ’08 |
CHANGE FROM ’08-’09 | CHANGE IN STOCK PRICE 12/31 08-09 |
|
| ’10 | ’09 | |||||||||||
| 1 | 4″ | Mark G. Parker (54) Nike* |
$13,118,834 $7,113,395 |
$1,475,000 $1,463,462 |
– – |
$3,500,003 $2,250,012 |
$3,510,270 $2,309,796 |
$4,441,875 $900,000 |
– – |
$191,686 $190,125 |
84.40% $6,005,439 |
29.50% |
| 2 | 3″ | Mark Donegan (53) Precision Castparts Corp.* |
$10,873,091 $6,994,194 |
$1,366,875 $1,275,000 |
$225,000 $500,000 |
– – |
$5,265,232 $3,924,750 |
$827,820 $1,189,350 |
$3,128,050 $63,830 |
$60,114 $41,264 |
55.50% $3,878,897 |
85.50% |
| 3 | 2″ | Earl R. Lewis (66) FLIR Systems |
$5,817,341 $8,917,342 |
$825,000 $823,206 |
– – |
$868,530 $657,932 |
$1,858,017 $1,453,590 |
$594,000 $2,095,500 |
$1,627,954 $3,847,576 |
$43,840 $39,538 |
-34.80% -$3,100,001 |
6.70% |
| 4 | NR” | Tamara L. Lundgren** (52) Schnitzer Steel Industries |
$3,725,171 $7,100,106 |
$775,769 $688,793 |
$225,000 $639,000 |
$1,398,391 $1,302,073 |
$52,865 $53,010 |
$1,200,000 $4,361,000 |
$31,335 $2,748 |
$41,811 $53,482 |
-47.50% -$3,374,935 |
26.70% |
| 5 | NR” | J. Greg Ness** (52) StanCorp Financial Group |
$3,723,004 $3,628,595 |
$612,500 $541,667 |
$291,915 $198,273 |
$210,541 $385,179 |
$941,703 $768,985 |
$315,315 $198,360 |
$1,266,498 $1,482,317 |
$84,532 $53,814 |
2.60% $94,409 |
-4.20% |
| 6 | NR” | Joshua L. Collins** (45) Blount International |
$3,301,365 NA |
$84,615 – |
– – |
– – |
$3,183,750 – |
$33,000 – |
– – |
– – |
NA NA |
6.50% |
| 7 | 13″ | Walden C. Rhines (63) Mentor Graphics Corp.* |
$3,128,172 $1,721,415 |
$659,551 $659,551 |
– – |
$715,028 – |
$987,760 $1,038,520 |
$758,483 – |
– – |
$7,350 $23,344 |
81.70% $1,406,757 |
70.80% |
| 8 | NR” | William P. Livek** (56) Rentrak Corp.* |
$3,036,228 NA |
$119,327 – |
$150,000 – |
$1,293,200 – |
$1,464,475 – |
– – |
– – |
$9,226 – |
NA NA |
49.90% |
| 9 | 9″ | Don R. Kania (55) FEI Co. |
$2,534,167 $1,847,771 |
$577,500 $577,500 |
– – |
$716,562 $993,600 |
$669,860 – |
$566,781 $273,735 |
– – |
$3,464 $2,936 |
37.10% $686,396 |
23.90% |
| 10 | NR” | Gregg S. Kantor** (52) Northwest Natural Gas Co. |
$2,418,958 $1,266,639 |
$446,000 $364,833 |
$234,848 $64,615 |
$243,631 $131,250 |
$136,508 $42,757 |
$330,152 $172,485 |
$994,375 $463,775 |
$33,444 $26,924 |
91.00% $1,152,319 |
1.80% |
| 11 | 12″ | Scott. C. Grout (47) RadiSys Corp. |
$2,398,262 $1,757,106 |
$478,570 $476,242 |
– – |
$987,735 $252,548 |
$547,430 $379,090 |
$375,917 $641,066 |
– – |
$8,610 $8,160 |
36.50% $641,156 |
72.70% |
| 12 | 7″ | Raymond P. Davis (60) Umpqua Holdings Corp. |
$2,316,716 $3,216,745 |
$714,000 $714,000 |
– – |
$320,400 $601,860 |
$184,000 $485,000 |
– $297,525 |
$1,054,236 $1,048,916 |
$44,080 $69,444 |
-28.00% -$900,029 |
-7.30% |
| 13 | 16″ | Nicholas Konidaris (65) Electro Scientific Industries* |
$1,938,067 $1,726,809 |
$475,781 $468,598 |
– – |
$623,283 $895,320 |
$581,700 $258,836 |
$257,303 $98,780 |
– – |
– $5,275 |
12.20% $211,258 |
59.40% |
| 14 | 17″ | Gerald K. Perkel (54) Planar Systems |
$1,793,777 $1,298,575 |
$462,083 $452,539 |
– – |
$1,188,476 $446,220 |
$117,943 $272,481 |
– $99,162 |
– – |
$25,275 $28,173 |
38.10% $495,202 |
360.70% |
| 15 | 24″ | Sidney B. DeBoer (66) Lithia Motors |
$1,546,466 $995,825 |
$840,000 $840,000 |
– – |
– – |
– $135,244 |
$679,200 – |
– – |
$27,266 $20,581 |
55.30% $550,641 |
152.10% |
| 16 | 26″ | Timothy P. Boyle (60) Columbia Sportswear Co. |
$1,525,243 $827,799 |
$810,000 $804,231 |
– – |
– – |
– – |
$686,556 – |
– – |
$28,687 $23,568 |
84.30% $697,444 |
10.40% |
| 17 | 15″ | William A. Furman (65) Greenbrier Companies |
$1,456,238 $1,394,646 |
$562,500 $708,333 |
– – |
$451,931 $232,038 |
– – |
– – |
– – |
$441,807 $454,275 |
4.40% $61,592 |
51.10% |
| 18 | NR” | James J. Piro** (57) Portland General Electric Co. |
$1,433,807 $887,486 |
$550,008 $370,194 |
– – |
$549,997 $185,478 |
– – |
$103,301 $271,944 |
$186,210 $35,172 |
$44,291 $24,698 |
61.60% $546,321 |
4.80% |
| 19 | 22″ | Michael D. Burger** (51) Merix Corp.† |
$1,329,466 $1,775,593 |
$563,076 $600,000 |
– – |
$342,280 $339,478 |
$344,009 $533,755 |
$64,191 – |
– – |
$15,910 $302,360 |
-25.10% -$446,127 |
775.00% |
| 20 | NR” | William T. Freeman** (50) McCormick & Schmick’s Seafood Restaurants |
$1,147,518 NA |
$399,630 – |
$250,000 – |
– – |
$457,500 – |
– – |
– – |
$40,388 – |
NA NA |
73.10% |
| RANK | EXECUTIVE (AGE) COMPANY |
TOTAL ’09 ’08 |
SALARY ’09 ’08 |
BONUS ’09 ’08 |
STOCK AWARDS ’09 ’08 |
OPTION AWARDS ’09 ’08 |
NON-EQUITY INCENTIVE PLAN COMP ’09 ’08 |
CHANGE IN PENSION VALUE ’09 ’08 |
ALL OTHER COMP ’09 ’08 |
CHANGE FROM ’08-’09 | CHANGE IN STOCK PRICE 12/31 08-09 |
|
| ’10 | ’09 | |||||||||||
| 21 | 20″ | Bruno Guilmart*** (49) Lattice Semiconductor Corp. |
$1,075,850 $3,180,201 |
$615,000 $307,506 |
– $290,000 |
– – |
$460,850 $2,416,200 |
– – |
– – |
– $166,495 |
-66.20% -$2,104,351 |
78.80% |
| 22 | 25″ | Joseph P. Schneider (50) LaCrosse Footwear |
$943,957 $939,841 |
$441,692 $440,000 |
– – |
– – |
$69,357 $85,702 |
$409,686 $393,125 |
– – |
$23,222 $21,014 |
0.40% 4,116 |
0.20% |
| 23 | 21″ | Ralph G. Quinsey (54) TriQuint Semiconductor |
$908,625 $1,357,431 |
$413,077 $414,953 |
– $40,000 |
– – |
$348,708 $891,924 |
$135,692 – |
– – |
$11,148 $10,554 |
-33.10% -$448,806 |
74.40% |
| 24 | 14″ | Robert C. Warren, Jr. (61) Cascade Corp.* |
$798,210 $1,078,064 |
$486,000 $540,000 |
– – |
$269,500 $472,483 |
– – |
– – |
– – |
$42,710 $65,581 |
-26.00% -$279,854 |
-7.90% |
| 25 | 18″ | Patricia L. Moss (56) Cascade Bancorp |
$632,850 $980,252 |
$391,400 $391,400 |
– – |
– $116,495 |
– $113,750 |
– – |
$221,470 $308,029 |
$19,980 $50,578 |
-35.40% -$347,402 |
-89.90% |
| 26 | 36″ | Patrick W. Cavanagh (56) Williams Controls |
$619,428 $432,714 |
$243,385 $260,000 |
– – |
– – |
– – |
$159,494 $163,514 |
– – |
$216,549 $9,200 |
43.10% $186,714 |
8.40% |
| 27 | 8″ | Bruce Davis (57) Digimarc Corp. |
$458,575 $5,255,775 |
$450,000 $410,000 |
– – |
– $25,000 |
– $3,552,523 |
– $135,000 |
– – |
$8,575 $6,492 |
-91.30% -$4,797,200 |
49.60% |
| 28 | 27″ | Bruce A. Walicek (53) Pixelworks |
$445,273 $926,098 |
$293,625 $343,750 |
$53,178 – |
$60,000 – |
$38,470 $257,348 |
– $325,000 |
– – |
– – |
-51.90% -$480,825 |
322.20% |
| 29 | 33″ | Hal M. Brown (56) Pacific Continental Corp. |
$430,288 $519,118 |
$297,250 $290,000 |
– – |
– – |
$76,560 $58,000 |
$56,006 $153,120 |
– – |
$472 $17,998 |
-17.10% -$88,830 |
-23.60% |
| 30 | NR” | James M. Ford** (51) PremierWest Bancorp |
$409,789 $298,665 |
$200,000 $220,000 |
– – |
– – |
– $24,824 |
– – |
$156,078 – |
$53,711 $53,841 |
37.20% $111,124 |
-78.80% |
| 31 | 19″ | Robert D. Sznewajs (63) West Coast Bancorp |
$407,545 $745,950 |
$360,000 $360,000 |
– – |
– $258,964 |
$19,572 $76,324 |
– – |
$27,148 $37,267 |
$825 $13,395 |
-45.40% -$338,405 |
-68.10% |
| 32 | NR” | Terry E. Michaelson** (56) Craft Brewers Alliance Inc. |
$337,227 $97,447 |
$213,462 $94,059 |
– – |
– – |
$6,465 – |
$107,500 – |
– – |
$9,800 $3,388 |
246.10% $239,780 |
100.00% |
| 33 | NR” | Joseph Lu (55) Powin Corp. |
$326,190 $720,660 |
$240,000 $84,000 |
$85,290 $636,660 |
$900 – |
– – |
– – |
– – |
– – |
-54.70% -$394,470 |
NA |
| 34 | 37″ | Gregory R. Hahn (54) Synthetech* |
$319,623 $416,328 |
$222,500 $211,250 |
$75,000 $155,000 |
– – |
– $28,240 |
– – |
– – |
$22,123 $21,838 |
-23.20% -$96,705 |
53.20% |
| 35 | NR” | Wayne A. Case (69) Schmitt Industries |
$285,751 $286,293 |
$249,504 $249,243 |
$30,000 $30,000 |
– – |
– – |
– – |
– – |
$6,247 $7,050 |
-0.20% -$542 |
-10.30% |
| 36 | NR” | Ralph Makar (49) Bioject Medical Technologies |
$259,267 $384,712 |
$246,923 $300,000 |
– – |
– $70,500 |
– – |
– – |
– – |
$12,344 $14,212 |
-32.60% -$125,445 |
85.70% |
| 37 | NR” | James W. Bernau (56) Willamette Valley Vineyards |
$222,695 $224,276 |
$173,379 $167,840 |
$43,653 $41,960 |
– – |
– – |
– – |
– – |
$5,663 $14,476 |
-0.70% -$1,581 |
17.40% |
| 38 | NR” | Chester L.F. Paulson (74) Paulson Capital Corp. |
$154,510 $198,393 |
$108,500 – |
– – |
– – |
– – |
$11,154 $85,776 |
– – |
$34,856 $112,617 |
-22.10% -$43,883 |
52.90% |
| 39 | NR” | F. Paul Carlson** (71) Cascade Microtech |
$96,281 $104,550 |
$20,731 – |
– – |
$26,050 $56,050 |
– – |
– – |
– – |
$49,500 $48,500 |
-7.90% -$8,269 |
134.90% |
| 40 | NR” | Donald M. Boone (69) Jewett Cameron Trading Co. Ltd. |
$41,879 $39,420 |
$36,000 $36,000 |
– – |
– – |
– – |
– – |
– – |
$5,879 $3,420 |
6.20% $2,459 |
36.20% |
Footnotes:
* Fiscal year ended in 2010
** Became CEO during most recent fiscal year
*** No longer serving as CEO
† Merged with St. Louis, Mo.-based Viasystems Group in February 2010.
