As a result of mounting investor pressure in recent years, the U.S. Securities and Exchange Commission has changed the requirements regarding the way companies disclose and value various elements of executive compensation in their annual proxy statements that go to all shareholders.
UNRAVELING CEO PAY
| ||||||||||||||||||||||||||||||||||||
It’s not only about how much, but why.
By Linda Steffen and Bill Smith
As a result of mounting investor pressure in recent years, the U.S. Securities and Exchange Commission has changed the requirements regarding the way companies disclose and value various elements of executive compensation in their annual proxy statements that go to all shareholders.
The SEC changes are an attempt to force companies to better disclose not only how much they are compensating CEOs and other top executives but also the process and logic behind their pay decisions. Of the companies represented in this year’s ranking of the highest-paid public-company CEOs in Oregon, 34 had fiscal year-ends after Dec. 15, 2006, and thus were subject to the new disclosure rules.
As was the case with last year’s Top 50 list, we continue to rank CEOs by summing the following components of compensation: base salary, actual bonus earned, the value associated with the opportunity of earning a long-term incentive and all other compensation.
Oregon’s highest-paid CEO on this year’s list is Mark Parker of Nike. His total compensation of $11.5 million included restricted stock and option awards totaling roughly $8.8 million. Parker was not on our list last year, as he was appointed Nike’s president and CEO in January 2006.
| |||||||||||||||
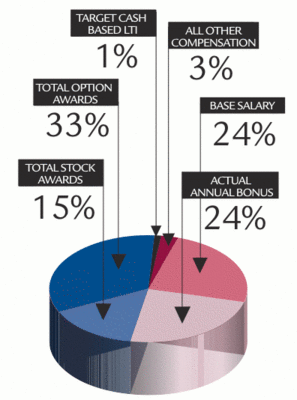
This year’s Top 50 highest-paid CEOs in Oregon saw a modest increase in their average total compensation. On average, total CEO compensation was $1,881,007, up $59,777 from 2005. The average base salary decreased by a relatively small amount. While the average bonus increased by $170,806, decreases in stock grants and stock option awards respectively tempered the overall increase. Five executives received bonuses of more than $1 million this year, compared to last year’s ranking, when only two executives received bonuses of more than $1 million.
Pay for performance: The new disclosure requirements are intended to help investors evaluate the connection between executive pay and company financial performance. Companies must now disclose the measures, expected levels of performance, the degree of difficulty associated with meeting performance goals, and the logic behind awards.
Bonuses: Twenty-two companies reported target bonuses, with the median CEO bonus target (as a percentage of base salary) of 78%.
| ||||||||||||||||||
New reporting requirements enable investors to compare the actual bonus earned for the year with what the CEOs were targeted to receive for expected performance. Twenty companies provided information that allowed for a calculation of a bonus achievement rate (actual bonus amount divided by target bonus amount). By comparing a company’s bonus achievement rate to its total return to shareholders for the year, investors can better assess the link between pay and performance.
|
In theory, there should be a positive correlation between bonus achievement and total shareholder return — companies with a CEO who’s earned more than their targeted award would be expected to have a positive total shareholder return. Most companies in Oregon showed the expected correlation between the pay and total shareholder return.
Long-term incentives: Long-term incentive equity grants continue to shift away from stock options and have moved to performance shares, restricted stock and cash-based long-term incentive programs instead. Even with this change, stock options continue to represent over half of the value granted in equity-based programs. Both restricted stock and performance shares displayed gains of 5%-6% of the total equity granted.
Other disclosure changes: The new disclosure regulations required additional pieces of information to be disclosed or elaborated upon. While the items that follow are noteworthy, they did not impact our calculations for 2006.
Deferred compensation. Although summary compensation must now include any above-market interest earned on deferred compensation, this amount is not included in the ranking calculation. Companies must report contributions and ending balances for deferred compensation for each executive in a separate table. Often, long-tenured executives will have large deferred-compensation balances. Such balances represent a type of tax-sheltered savings for the executive as well as a loan to the company from the executive.
Pensions. Under the new reporting requirements, each company must provide an actuarial estimate of the current value of all defined benefit pension programs. This amount is not included in our ranking calculation because of the various uncontrollable factors (age, years of service and other assumptions used for the calculation) that may trigger a substantial increase or decrease in the value of the pension from year to year.
Termination scenarios. To inform investors of any potential compensation that an executive may receive in the future under existing agreements, the company must disclose payment under all possible termination scenarios. Executives often receive payments upon leaving the company, including: voluntary termination, involuntary termination without cause, change in control, death or disability. Termination scenario disclosure allows an investor to determine if a company has golden parachute arrangements and to see the potential payout levels upon termination.
Although the new disclosure rules have required companies to provide broader and deeper data, the greatest challenge investors face is finding meaningful ways to interpret this information and form meaningful conclusions not only about how much is paid but also about why various programs are used.
Linda Steffen and Bill Smith are members of the Northwest Compensation Consulting Practice of Watson Wyatt Worldwide, an international human resource consulting firm.
Have an opinion? E-mail [email protected]


