
 Agriculture is an economic driver and brings in dollars from outside state borders.
{artsexylightbox}{/artsexylightbox}
BY BRANDON SAWYER
Maybe it’s because agriculture happens mostly outside the urban environment where most Oregonians live. Maybe it’s because farming seems an antiquated occupation and its present-day workforce is overlooked. Maybe it’s the 21st-century focus on organic and value-added crops, community-supported agriculture and backyard vegetable gardens. Whatever the reason, somehow most of us have forgotten about the huge role played by agricultural commodities in Oregon’s economy.
We’re talking single-syllable mainstays like wheat, hay, pork and pears. The consumer and industry focus on certification, heirlooms and buying local has certainly elevated agriculture, but such (trendy) products are dwarfed by the economic force of the state’s major commodities that are grown large-scale and feed a sophisticated export infrastructure, sending fresh and raw products overseas as well as supplying the region’s food processors, stores and restaurants.
Agricultural production alone was estimated at a record high $5.4 billion value by the Oregon Department of Agriculture (ODA) in 2012, topping 2011 by 2%. But ag’s “economic footprint” as estimated by Oregon State University’s Extension Service – production, processing, support services, food and drinking establishments, wholesale and retail trade, transportation and warehousing – generated direct and indirect sales of $49.1 billion in 2009. That’s 17% of statewide economic output, supporting 422,891 or 19% of total jobs. That’s a huge footprint, yet so low profile and geographically vast that it’s easy to miss.


Click on graphs to view larger
{artsexylightbox}{/artsexylightbox}
Oregon’s top ag commodities are a diverse bunch. The No. 1 in 2012, according to preliminary ODA figures, was greenhouse and nursery products, a grab bag of pampered plants, shrubs, bulbs and turf sod highly dependent on the national real estate market. In 2008 the value of this group plunged 17% following the U.S. housing-market collapse, then fell another 6% and 3% in 2009 and 2010 respectively, before finally stabilizing the last couple years above $740 million. “They were up to over $1 billion before the recession,” says Stephanie Page, special assistant to the director at the ODA. “There’s still some distance to go there.” Grass seed, the state’s No. 6 commodity in 2012 with a value of $411 million, was also hit hard by the housing crisis and is seeing incremental growth again.
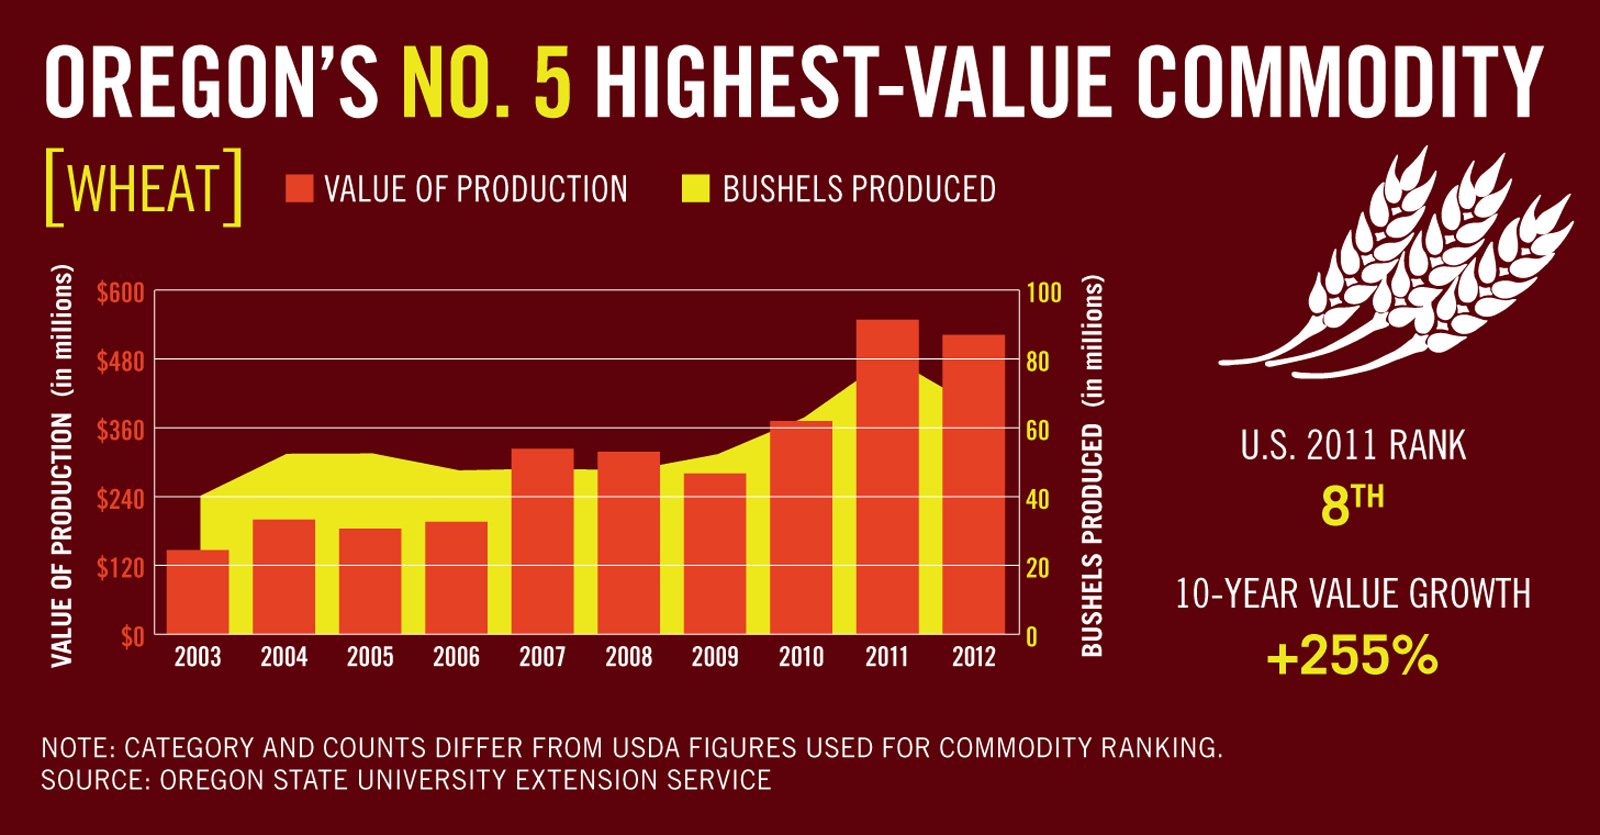
Some Willamette Valley grass-seed farmers held their own by planting wheat during the recession, notes Page. Wheat was the No. 5 top commodity in 2012 with a value of $472 million and has grown more than 250% during the last decade, due to the misfortunes of other wheat-growing regions around the world and high global demand. The year 2013 may be more of a bust, though, after the GMO scare that temporarily suspended wheat exports to Japan and South Korea, but especially because of drought in Eastern Oregon, where the crop is grown without irrigation. Page drove through Gilliam County this summer and wondered to herself if they were growing an experimental crop before realizing it was stunted wheat.
In 2011, before greenhouse and nursery reclaimed its throne, hay was, well, making hay as the top commodity with a statewide value of $752 million, up dramatically from $488 million in 2010. “Hay has been a pretty interesting story,” says Page. “The rising tide in terms of feed-commodity prices helped boost hay prices.” Hay still ranked high at No. 3 in 2012 with a preliminary value of $638 million.


Click on graphs to view larger
{artsexylightbox}{/artsexylightbox}
Higher prices for hay and feed grain have made it tougher for cattle ranchers to turn a profit, though the value of the beef industry has been rising. Cattle and calves were the No. 2 commodity in 2012 with a production value of $654 million per the ODA (OSU’s Extension Service estimated it quite higher, at $833 million). “It’s hard for the producers to pass the increased input costs on to the consumer,” Page says. “You have people liquidating herds because they’re not able to continue to produce what they were, and then you get tighter supplies, and prices go up.” Oregon’s No. 4 commodity, milk, is also facing the challenge of high input prices, adds Page, while enjoying climbing production value — $498 million in 2012.
While it doesn’t beat out other states for production of most of its larger commodities, Oregon ranked No. 1 for production of 14 smaller ag commodities. In 2012 it produced 100% of U.S. commercial hazelnuts, blackberries, boysenberries, loganberries and black raspberries. It was also No. 1 for five varieties of grass and clover seed, azaleas, peppermint and, of course, Christmas trees. It was in the top three for many more, including sweet cherries, strawberries, red raspberries, pears, cranberries, wine grapes, hops, dry storage onions, garlic and, believe it or not, mink pelts.
Hot off a consumer health craze and new fresh exports to Asia, blueberries, at No. 11, are on the verge of breaking into the state’s top 10 with a $108 million value in 2012. The state is the third-biggest producer of blueberries in the nation, part of its impressive berry and tree-fruit ag portfolio that supplies a booming fresh and processed-fruit industry. There are more than 38,000 farms in Oregon comprising 16.5 million acres. Eighty-five percent of them are owned by individuals, still mostly family farms. Quietly and with little fanfare, these agricultural producers and the industries that serve them or thrive on their products keep growing our food, seeding our lawns, shearing our wool and more. Equally important, these industries create hundreds of thousands of jobs, bringing in export revenue from abroad and driving a substantial part of the state economy.


Click on graphs to view larger
